BrewInsights is were you will find a modal with some of the most pertinent information about a tapped keg. This article will help you understand BrewInsights.
How to Navigate to BrewInsights:
First, go to the BrewOnTap page by clicking On Tap.

Then, click on the keg icon in any of the Tap Cards (to learn more about Tap Cards, click here) to open the BrewInsights page.
Understanding the BrewInsights Page:
Below is a sample BrewInsights page with different subsections annotated with a red number and explained in its corresponding number below.
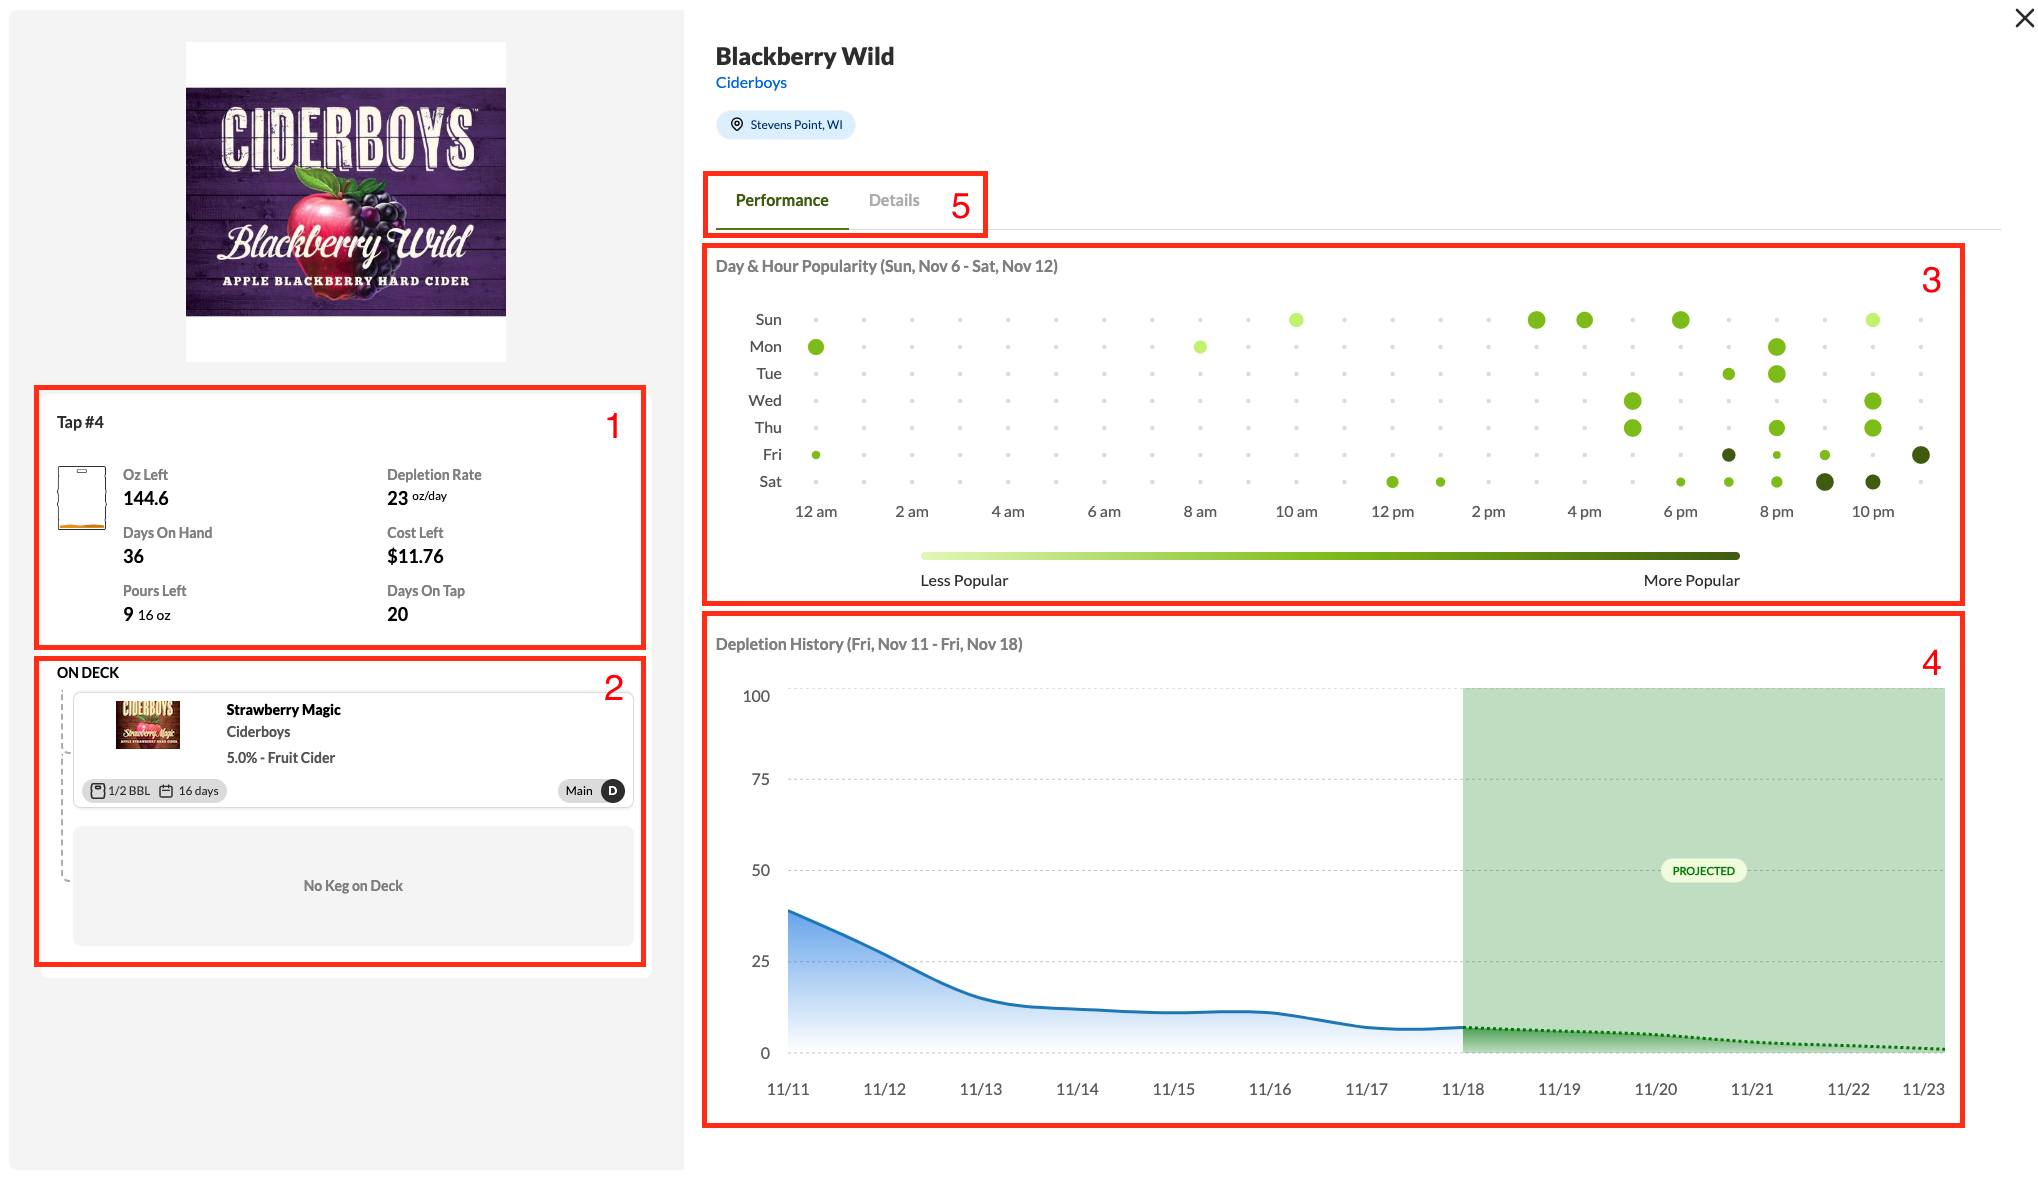
1. Tap Info
In this subsection you will see advanced data regarding the vitals of your keg including Oz Left, Depletion Rate (oz/day), Days On Hand, Cost Left, Pours Left, and Days On Tap.
2. On Deck
In this subsection you will see what is on deck, if anything, for the selected tap. To learn about putting products on deck, click here.
3. Day & Hour Popularity Heatmap
This subsection provides you with an hour-by-hour, day-by-day log of depletions in the form of a heatmap. This data visualization is used to illustrate the keg's popularity over a fixed window of time.
4. Depletion History
At the bottom of the BrewInsights page is the Depletion History chart. The y-axis measures percentage of the keg remaining and the x-axis measures time. Hovering your mouse over different parts of the chart will show you the percentage of keg remaining and ounces poured for the selected time. The blue side of the chart indicates actual pour data, while the green side indicates a projection based on the history of the keg.
5. Tap Card Details
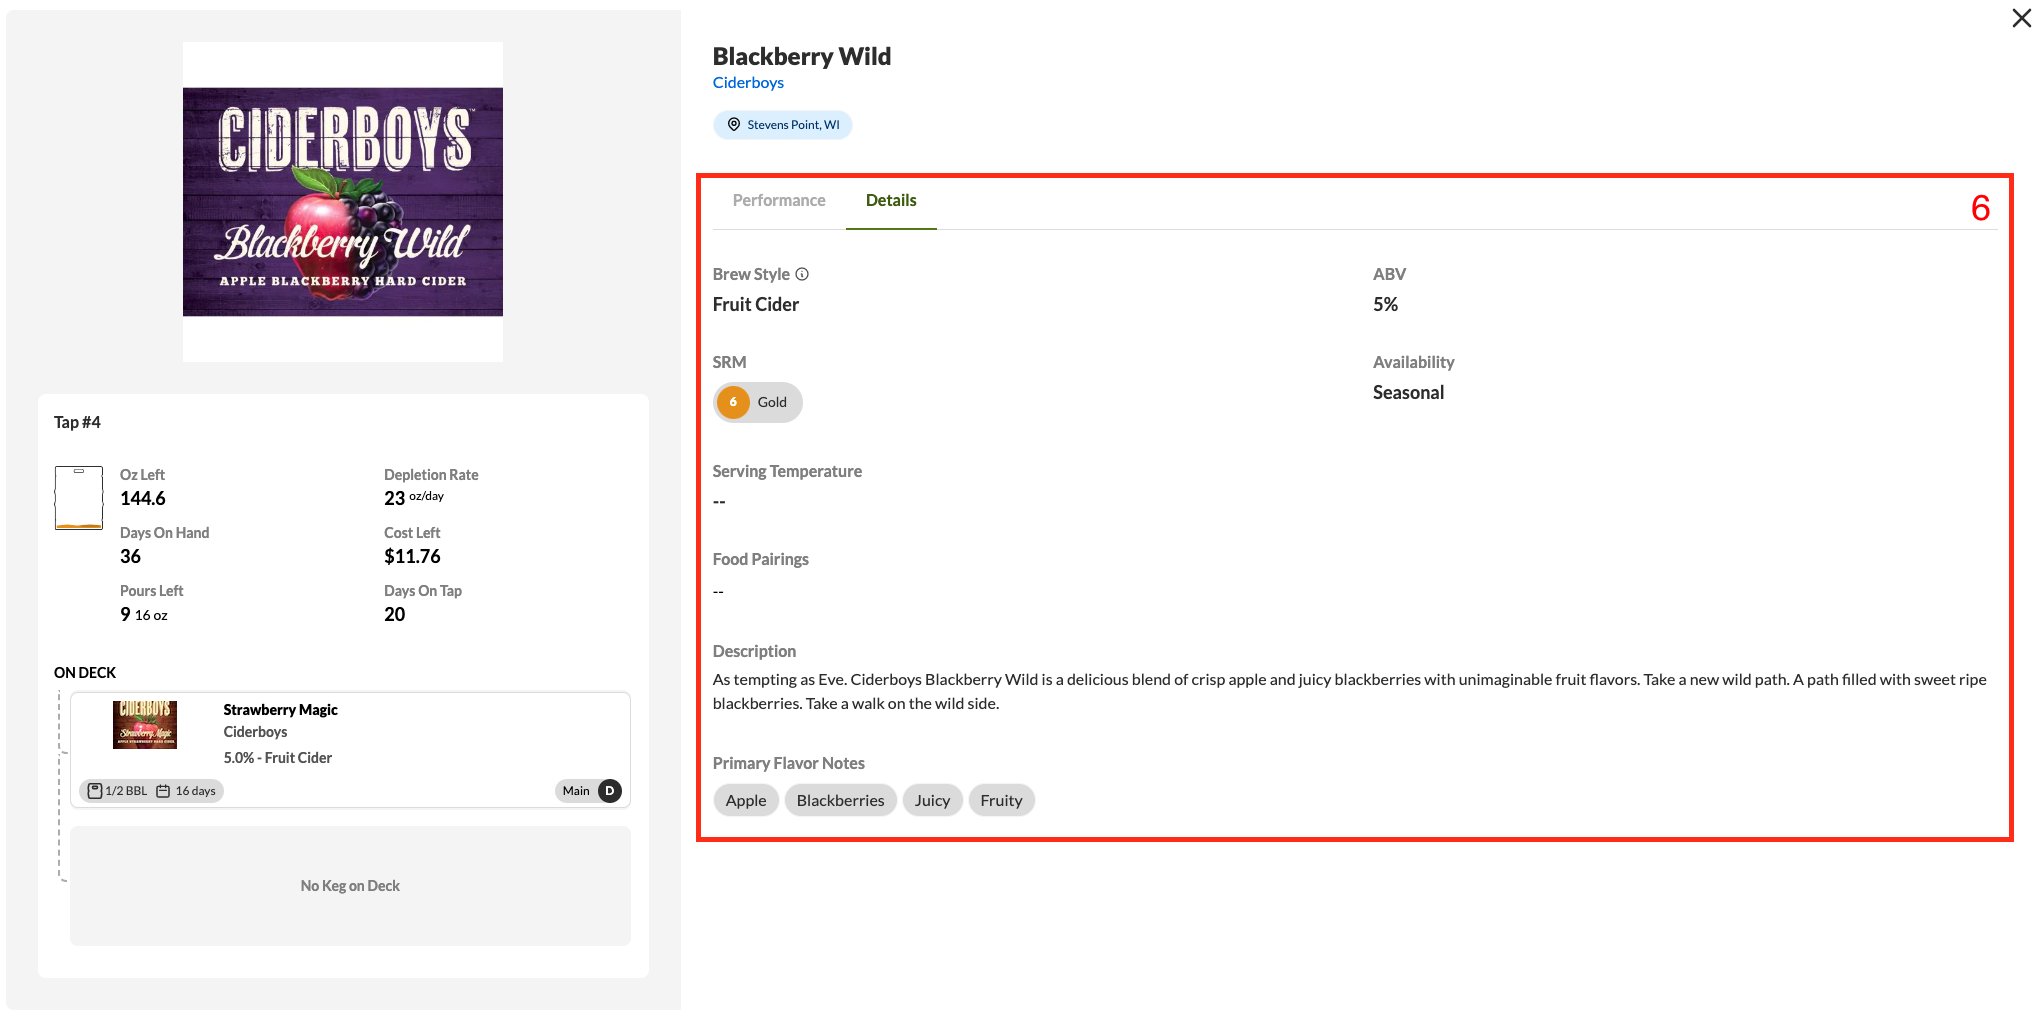
Here, you can select between the Performance or Details subsection. Numbers 1-5 above account for the Performance subsections. Number 6, below, represents the Details subsection.
6. Tap Card Details
In this subsection you will see information pertaining to that particular brew style such as ABV, recommended Food Pairings, color/SRM, etc.